
Overview
The Fullpath Dashboard Widget Performance page provides performance metrics about your onsite engagements and conversions. Website Engagement reporting pulls from two sources including your website and Google Analytics.
You may access these reports from inside your Fullpath Dashboard by clicking into Website Engagement > Reports Tab.
Functionality
The date picker in the upper right hand corner allows you to view performance date from specific time periods. The default range is set to the previous two weeks.
Metrics displayed
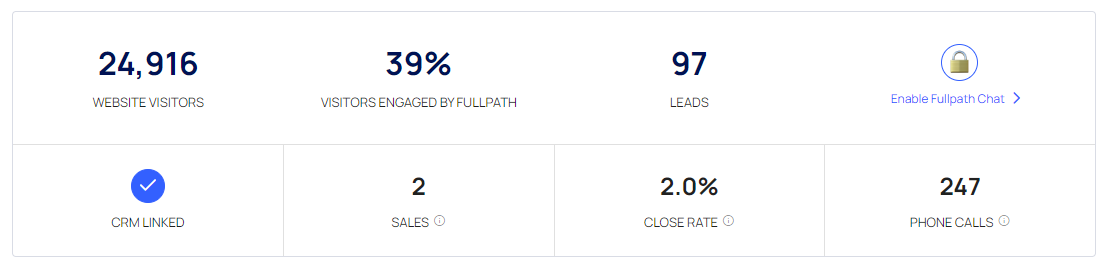
- Website Visitors
- Visitors Engaged by the onsite widget
- Leads - Unique leads converted on the widget
- Chat - Requires Chat to be turned on
- CRM Linked - Requires CRM Link
- Sales - Requires CRM Link
- Close Rate - Requires CRM Link
- Phone Calls - Requires Click-to-call turned on
Conversions by Interaction Type
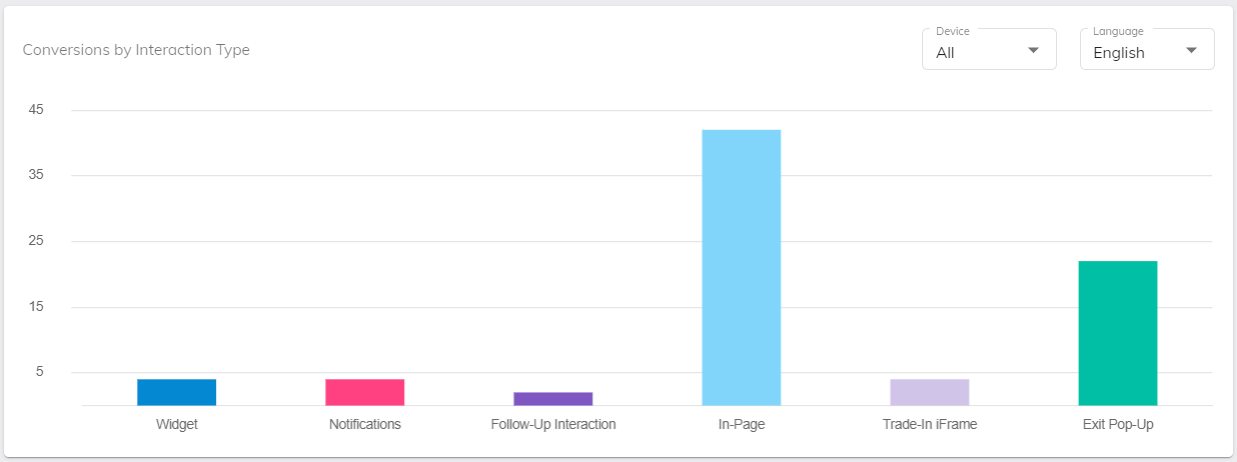
This graph displays the breakdown of how your shoppers are interacting with and converting on your site via Fullpath. Read here to learn more about the interaction types.
Chat Performance
Chat Performance metrics show you how Fullpath Chatbot or Ai Powered ChatGPT is performing on your website, broken down by Sales and Service. These metrics are only available if you have Chat turned on.
Conversions by Vehicle Type
Vehicle Type is determined by the page upon which the shopper converted. Only conversions on VDPs and SRPs have known vehicle types. This data gives you valuable information about how your inventory is performing, and the types of shoppers that are converting on your website.
Leads by Day of Week and Leads by Time of Day
These two graphs can show you what day of the week as well as what time of day you are getting the most conversions. The graphs show the average of all of the data in the selected date range.
Conversions by Page Type
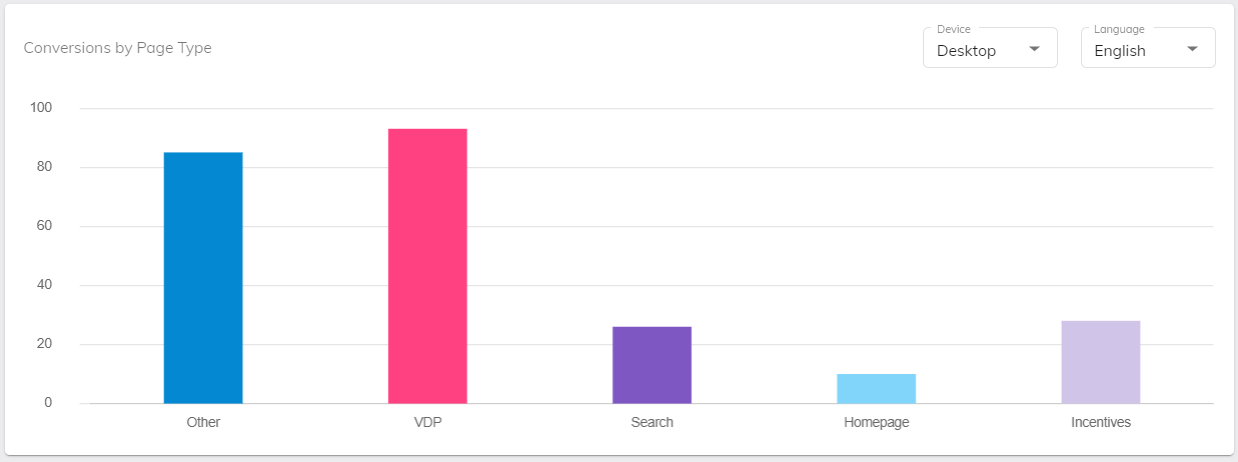
The Conversions by Page Type graph displays which pages your customers are converting the most on. This data, coupled with information like Landing Page performance, can help you determine which pages to invest more effort in to create the most seamless and effective customer experience.
Offer Performances
The Offer Performance metric displays a breakdown of conversions between your dealership’s different offer types (OEM, dealer, website, etc. This data can help you decide what offers speak the most to your customers, and which to continue investing in.
This metric is only available if the offers module is turned on, and there were live offers during the selected time period.
Leads with Multiple Conversions
This metric displays how many of your onsite leads converted multiple times.